Think of how damaged and polluted it was the environment at the moment COVID-19 started spreading… After a few weeks, the spread of the virus became global, with the hard effect of shutting down the whole human activity all over the world.
Although the shutdown has been dramatic and brought several difficulties to human beings and to the economy, the environment has benefited from the stop to the industrial activities at the global level.
The main goal is to build an environmental network of sensors to measure the quality of the air during the reopening phase after the peak of the Pandemic.
The "Measurement Stations" collect data about several elements in the atmosphere and send the telemetry to the datacenter for elaboration.
At the moment, only GAS and PARTICULATES telemetries are implemented.
The community is keen to receive support and contribution around the implementation of additional telemetries:
Light
Temperature
Humidity
…
The datacenter stores two types of data:
Runtime - Data collected by the stations
Historical - aggregated data coming from third party data source
and gives an overview of the following:
Runtime analysis - A real-time dashboard shows real-time data coming in the datacenter.
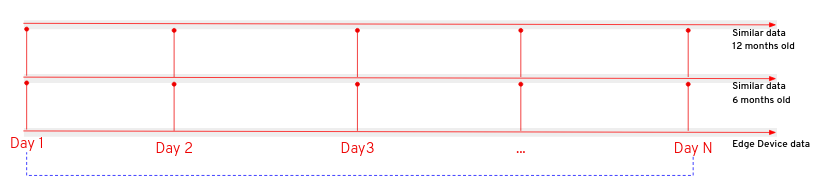
Localized comparison - The most relevant considerations come from the comparison between the current data collected by the stations and the third party information collected 6 and 12 months before. This specific comparison refers to a specific day in the time-frame
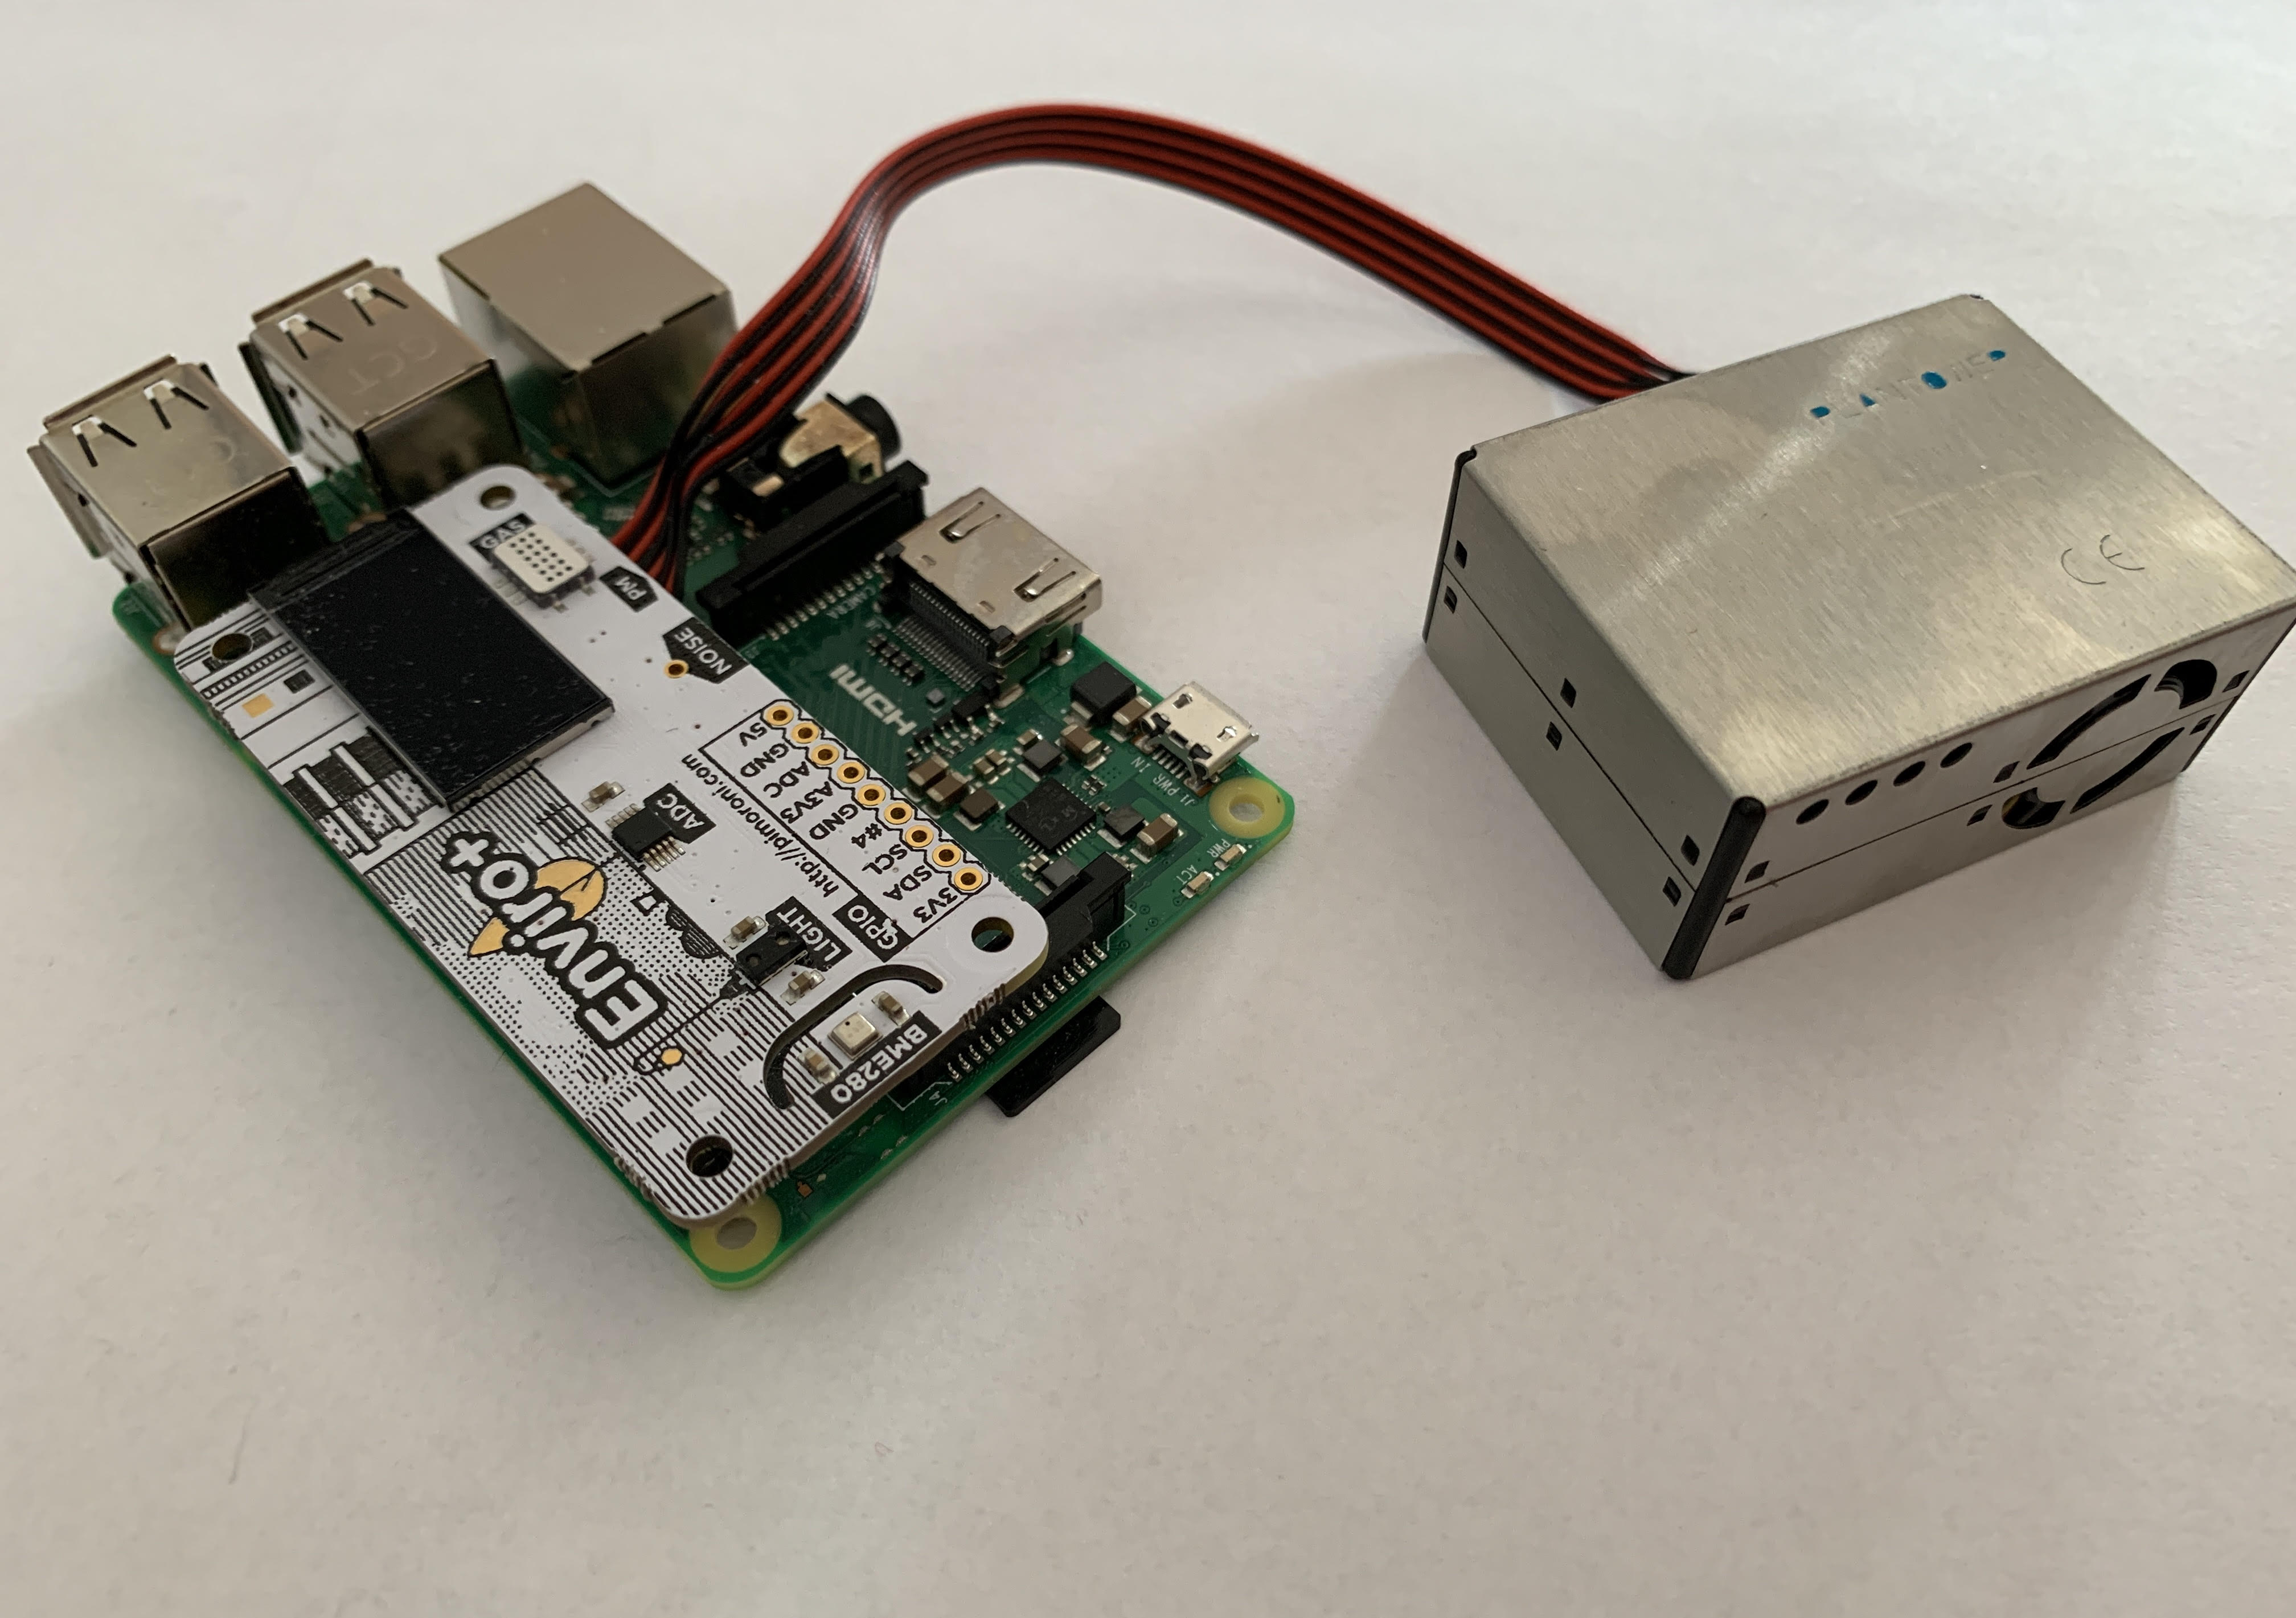
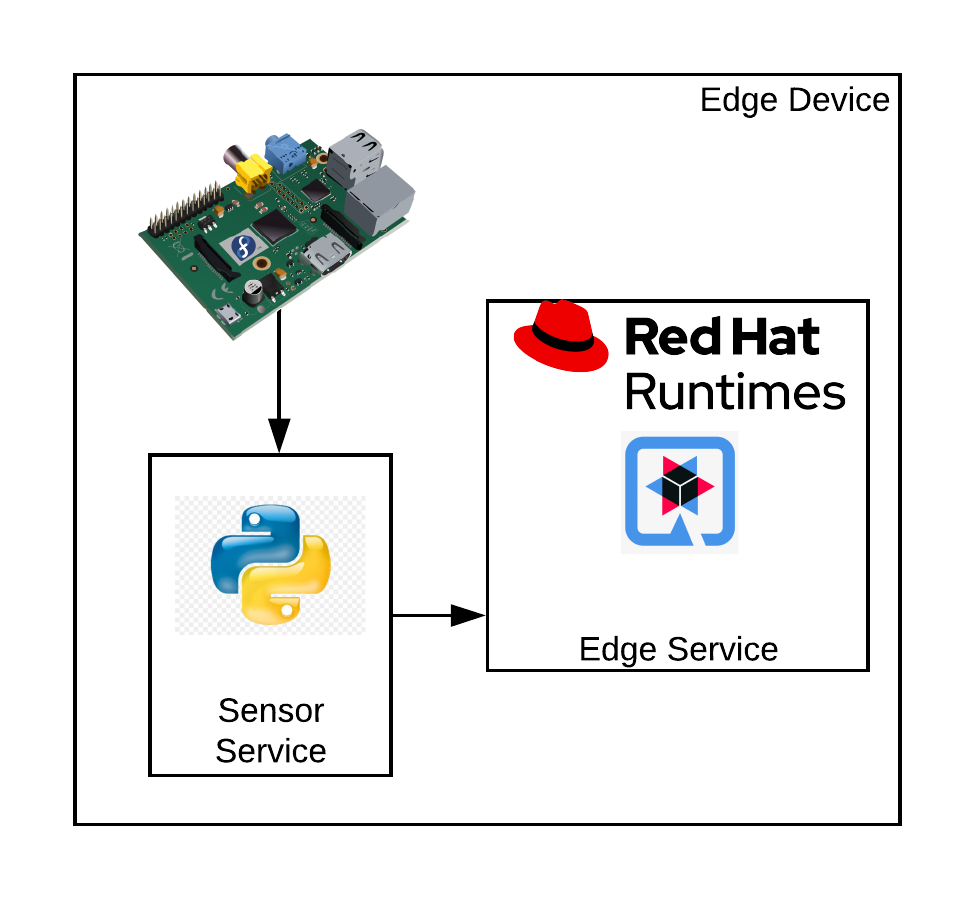
The Far Edge edge device represents the implementation of a measurement station.
To get an advice about installing the measurement station outside of the building in order to collect PMS telemetry, please refer to the following article: An outdoor air quality station with Enviro+
The edge device hardware is made up of two integrated sets of components.
A single-board computer to deploy the business logic
A sensor board
A PMS
The components are, of course, designed and structured to work smoothly together, so there is no need to bother with the physical checks and testing.
A deeper look into the hardware specs:
The Hardware of choice for the edge is raspberry pi 3 model B+.
The Pi 3 Model B+ has a 1.4GHz 64-bit quad-core Broadcom Arm Cortex A53-architecture processor.
Choosing the target single-board computer model has been quite an easy task: I already had a Raspberry Pi meeting the requirements above:
Model |
Raspberry Pi 3 B+ |
SOC |
Broadcom BCM2837B0, Cortex-A53 (ARMv8) 64-bit SoC |
CPU |
1.4GHz 64-bit quad-core ARM Cortex-A53 CPU |
RAM |
1GB LPDDR2 SDRAM |
WIFI |
Dual-band 802.11ac wireless LAN (2.4GHz and 5GHz ) and Bluetooth 4.2 |
Ethernet |
Gigabit Ethernet over USB 2.0 (max 300 Mbps). Power-over-Ethernet support (with separate PoE HAT). Improved PXE network and USB ass-storage booting. |
Thermal management |
Yes |
Video |
Yes – VideoCore IV 3D. Full-size HDMI |
Audio |
Yes |
USB 2.0 |
4 ports |
GPIO |
40-pin |
Power |
5V/2.5A DC power input |
Operating system support |
Linux and Unix |
Enviro + Air Quality features
for this purpose, we used
BME280: temperature, pressure, humidity sensor (datasheet)
LTR-559: light and proximity sensor (datasheet)
MICS6814: analog gas sensor (datasheet)
ADS1015: analog to digital converter (ADC) (datasheet)
MEMS: microphone (datasheet)
For this use-case we picked up a PMS5003
Parameter |
Index |
unit |
Range of measurement |
0.3~1.0; 1.0~2.5; 2.5~10 |
Micrometer(μ m) |
Counting Efficiency |
50%@0.3μ m 98%@>=0.5 |
μ m |
Effective Range(PM2.5 standard) |
0~500 |
μ g/m³ |
Maximum Range(PM2.5standard)* |
≥1000 |
μ g/m³ |
Resolution |
1 |
μ g/m³ |
Maximum Consistency Error (PM2.5 standard data)* |
±10%@100~500μ g/m³ ±10μ g/m³@0~100μ g/m³ |
|
Standard Volume |
0.1 |
Litre(L) |
Single Response Time |
≤10 |
Second(s) |
Total Response Time |
≤10 |
Second(s) |
DC Power Supply |
Typ:5.0 Min:4.5 Max: 5.5 |
Milliampere(mA) |
Active Current |
≤100 |
Milliampere(mA) |
Standby Current |
≤200 |
Microampere(μ A) |
Interface Level |
<0.8 @3.3 H >2.7@3.3 |
Volt(V) |
Working Temperature Range |
-10~+60 |
℃ |
Working Humidity Range |
0~99% |
|
Storage Temperature |
-40~+80 |
℃ |
The software running on the edge device has a dual purpose:
Integrate with the sensors board and the PMS
Interact with the data hub to share collected data
The business logic of the measurement station has been entirely implemented using cloud-native frameworks and packaged using container technologies.
The operating system matters as well as the services running on it. For the purpose of this implementation, the OS of choice must fulfill the following requirements:
Must be fully-fledged 64 bit OS (not just its kernel)
Must have a very small memory footprint
Must be immutable or at least, modular
Must have the ability to run a container engine with the minimum memory footprint, like Podman or CRI-O
Must support all of the following hardware component used by the sensor board:
I2C
SMB
uart
At the moment, the only stable operating system which has all of the characteristics described above is Fedora IoT.
Fedora IoT 33 must be used in order to have a stable environment as a base for software development for the edge device.
This service exposes apis to connect to sensors and grab raw telemetry and for the Hackfest purposes it must be implemented as containerized service.
The technology vendor has put together a Python library to control all the parts of your Enviro and Enviro + Air Quality. To implement the sensor service business logic Python 3.9+ is highly recommended. That specific version is already available into the operating system of choice.
Lots of examples for each of the individual parts, all-in-one examples that show you the data from the sensors in a visual way are available as well at this link.
Last, but not least, have a read through the official Getting Started with Enviro+ tutorial that walks you through how to install the software, how to run the code examples, and how to use the Python library.
The easiest and cheapest way of accessing the sensor service is through unsecured rest API. The Flask project is an excellent and lightweight tool to integrate python rest API with container technology.
No need to secure sensor service API, cause this service is designed to be an internal service with no exposure to the network.
The Edge service is responsible for the Data Hub the telemetry collected from the sensors.
The main goal of the QIoT Community is to implement this service using Quarkus and to run it natively into a container (possible on 64bit OS only!).
Moreover, the Edge Service, as well as the Sensors Service, should have the smallest memory footprint as possible and perform the transactions with the API exposed by the Data Hub in the shortest time.
In this scenario, we have the freedom of picking up the programming language of choice.
So, thinking of the availability in the IT industry, the best choice at the moment is the Quarkus framework.
The Edge service is expected to send one message every 5 seconds.
More details about the data flow will be provided in the next chapters.
The Datahub has been designed and implemented by the QIoT technical team and is made up of several services and business logic to manage, store, aggregate and retrieve data.
Data types are split into two main categories: Station and Telemetry.
Additionally, a third party data type is stored statically into the datahub in a raw format which is normalized and adapted to the Measurement format every time the QIoT Dashboard service performs a data search.
The infrastructure of the QIoT project must have flexible imprinting and should be easily scalable both horizontally and vertically. To fulfill the scalability requirements a Cloud-based platform is needed. The only compulsory prerequisite for the cloud provider is OCP certification.
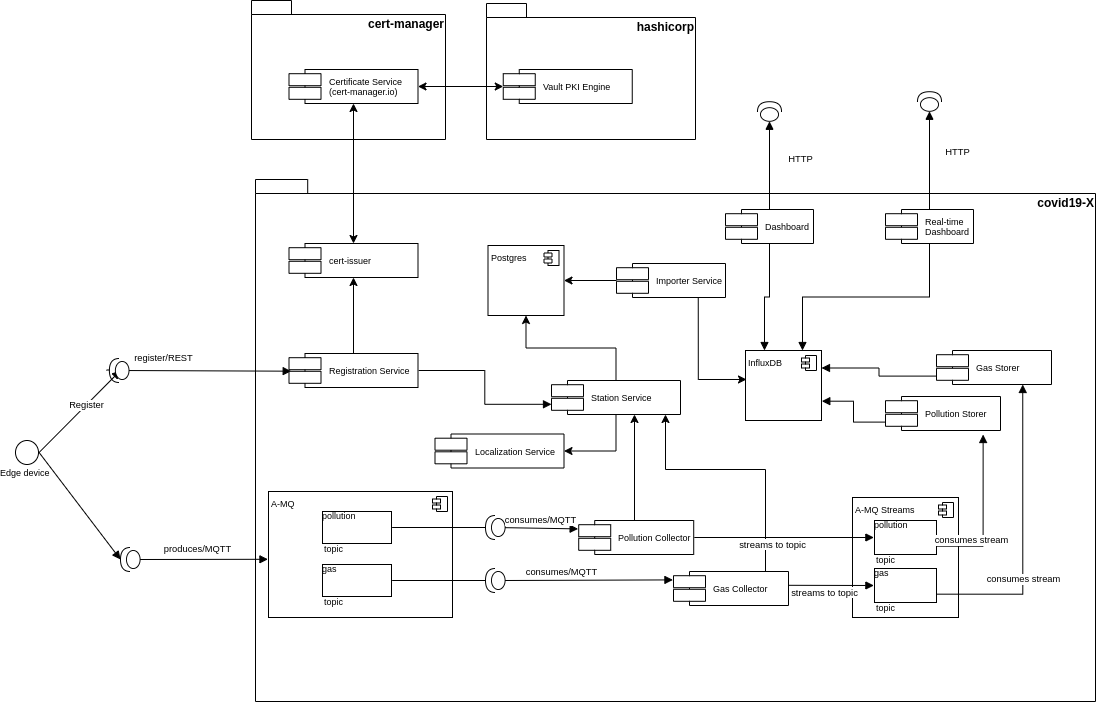
A graphical representation of the basic Infrastructure Architecture:
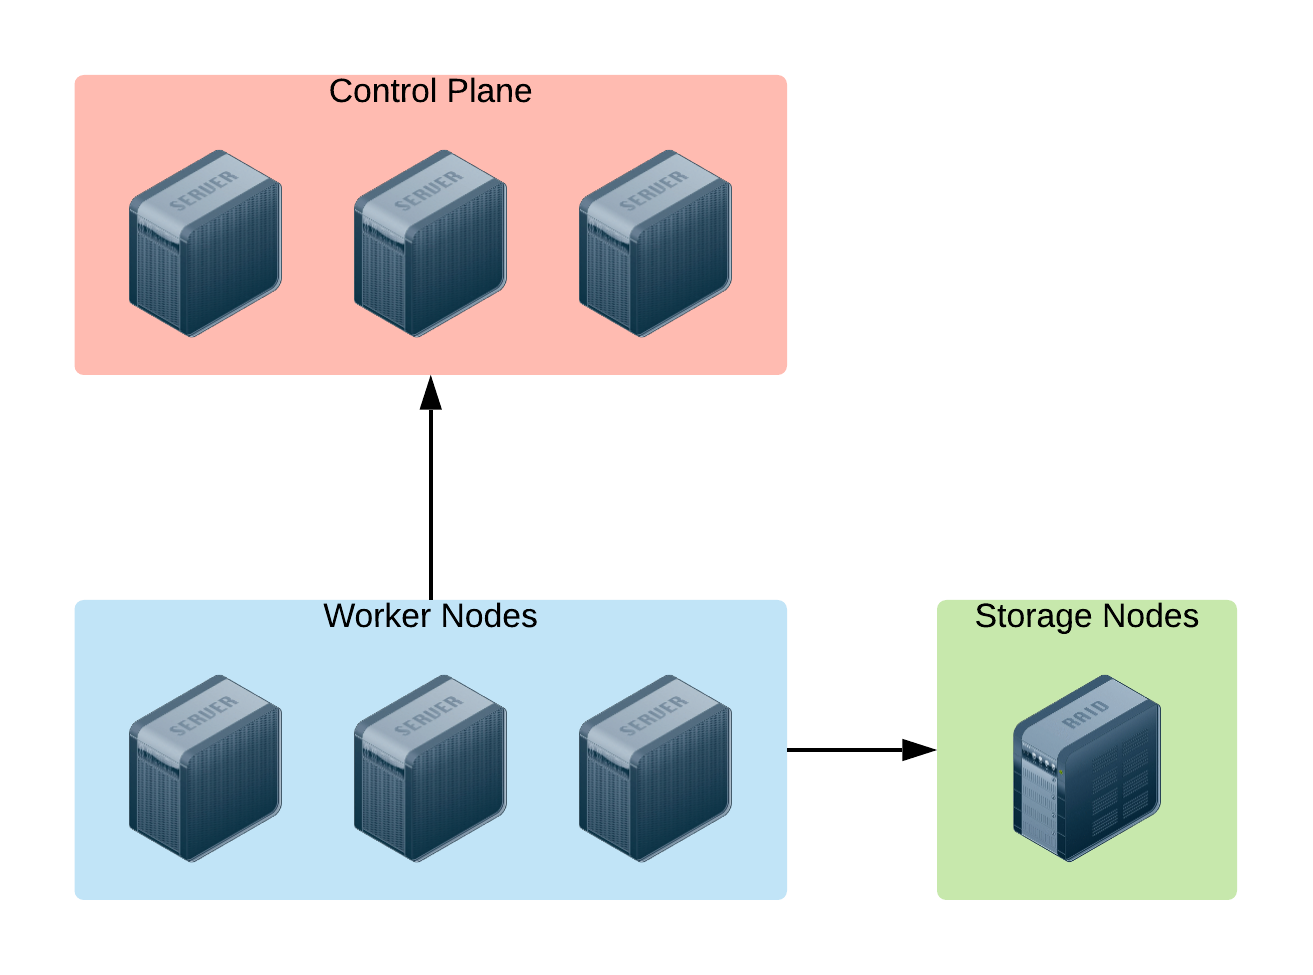
Based on the image above, here is the sizing of the infrastructure provisioned for the Openshift Container Platform:
OCP Control Plane (master nodes)
#Servers: 3
CPUs: 8
RAM: 24G
OCP Worker Nodes:
#Servers: 3
CPUs: 12
RAM: 64GB
Storage Server: provides storage functionality to the infrastructure to store data safely and consistently on the disk. There’s no urgent/compulsory need to add this component to the infrastructure architecture, at least at the early stage of the project, because the basic amount of storage provided by the cloud platform would definitely cover all the needs described.
Some additional storage will be needed in case of extended lifetime and participation in the project (i.e. lots more data arriving at the Data Hub). Anyway, just making use of the storage layer from the cloud provider of choice and installing Openshift Container Storage on top of it will guarantee horizontal scalability and data consistency all over the container platform out of the box.
Vertical scalability is guaranteed by the could platform. Horizontal scalability is guaranteed by Openshift by using the auto-scaling feature embedded in the container platform.
Red Hat OpenShift is the hybrid cloud platform of open possibility: powerful, so you can build anything and flexible, so it works anywhere.
Adopting the Openshift container platform made us save tons of hors implementing features and behaviors supposed to be home cooked, otherwise:
Native pipelines using Tekton
One-shot installation using Helm charts
2-day operations using Operator Framework
Container storage
Security and Isolation
Automate cluster scalability
More about Openshift Container Platform can be found here.
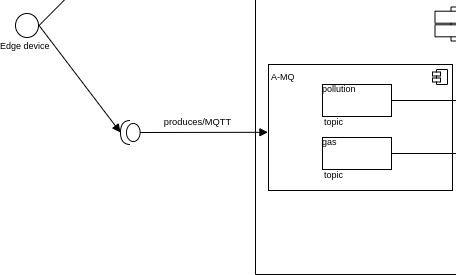
Exposes the endpoint for the telemetry coming from the measurement stations. The endpoint is exposed through the MQTT protocol, protocol of choice for the implementation of IoT architectures.
Since it is possible to send two different type of telemetries (pollution and/or gas), The A-MQ broker manages two isolated and scalable topics:
pollution
gas
Technical details about the telemetry and the endpoints to be given in the next chapters.
AMQ Broker is a pure-Java multiprotocol message broker. It’s built on an efficient, asynchronous core with a fast native journal for message persistence and the option of shared-nothing state replication for high availability.
Persistence - A fast, native-IO journal or a JDBC-based store
High availability - Shared store or shared-nothing state replication
Advanced queueing - Last value queues, message groups, topic hierarchies, and large message support
Multiprotocol - AMQP 1.0, MQTT, STOMP, OpenWire, and HornetQ Core
Integration - Full integration with Red Hat JBoss EAP
AMQ Broker is based on the Apache ActiveMQ Artemis project.
In the forecast of the need for receiving/handling a large number of concurrent messages, A-MQ Streams is the component of choice for streaming messages through the integration and the storage layers. An internal streaming service guarantees scalability and reliability of the message flow management within the Datahub business logic.
The A-MQ Streams topics have the same design as the A-MQ topics: one topic per telemetry, with the chance to fine tune connections, scalability and message flow and retention separately.
This design makes it a lot easier to decouple the implementation details of the integration services responsible for offloading (consuming messages from) every topic and storing the values into the storage tier, improving horizontal scalability.
More about A-MQ Streams can be found here.
Timeseries database engines are the technology of choice to store the telemetry coming from the IoT devices in an Edge Computing scenario.
For this usecase we have picked up Influxdb, as it guarantees, scalability, reliability and a level of performances not achievable using other competitors on the market.
Moreover, InfluxDB is the essential time series toolkit — dashboards, queries, tasks and agents all in one place.
As well as for the previous software infrastructure components used to receive and stream data, we have decided to go for a separation by telemetry-time.
More about InfluxDB can be found here.
PostgreSQL is a powerful, open source object-relational database system with over 30 years of active development that has earned it a strong reputation for reliability, feature robustness, and performance.
The relational database engine is used to store non-timeseries data like:
Measurement Station data
Third-party station data
Aggregated third-party measurements
More about PostgreSQL can be found here.
Cert-manager automates certificate management in cloud native environments and thus helped with the implementation of a dynamic certificate provisioning for edge devices
cert-manager builds on top of Kubernetes, introducing certificate authorities and certificates as first-class resource types in the Kubernetes API.
This makes it possible to provide 'certificates as a service' to developers working within your Kubernetes cluster.
Highlights
Provide easy to use tools to manage certificates.
A standardised API for interacting with multiple certificate authorities (CAs).
Gives security teams the confidence to allow developers to self-server certificates.
Support for ACME (Let’s Encrypt), HashiCorp Vault, Venafi, self signed and internal certificate authorities.
Extensible to support custom, internal or otherwise unsupported CAs.
More about out cert-manager implementation here
More about Cert-Manageranager can be found here.
The Datahub business logic is build on top of Quarkus framework. All the services run natively on top of the container technology and benefit from the features from the Serverless architecture.
A separate discussion must be done for the Dashboard, which exposes diagrams based on the telemetry coming from the measurement stations and in implemented on top of RedHat build of Node.js
Microservice implemented on top of the Quarkus Framework.
This service is compiled and runs in native mode.
It’s responsible for the management of the Edge Device in the ecosystem.
It exposes a rest API secured with mutual authentication. details about the exposed endpoints are available in the Specs section
More details can be found in the dedicated repository.
Microservice implemented on top of the Quarkus Framework.
It’s responsible for the management of the Edge Device data.
Data are stored in PostgreSQL to take advantage of the CRUD operations.
As this service is used by the Collectors to enrich the incoming telemetry, the data are locally cached using a 2nd level cache
More details can be found in the dedicated repository.
Microservice implemented on top of the Quarkus Framework.
Simple route to convert the coordinates sent by the Measurement station at registration time.
In order to perform the Reverse Geocoding, the service calls the REST APIs exposed by a third party service: Nominatim by OpenStreetMap
Microservice implemented on top of the Quarkus Framework.
This service is compiled and runs in native mode.
This service is responsible for validating/enriching/storing the raw telemetry coming from the stations.
The main reason why we’ve split the two services is for scalability and extensibility purposes:
Thanks to the Commons module, it’s easy to extend the group of services to make them accept an additional telemetry type;
As the frequency of incoming messages per telemetry type can vary, scaling feature affects only one service in the group;
More details can be found in the dedicated repository.
Microservice implemented on top of the Quarkus Framework.
This service is responsible for store the messages consumed from the A-MQ Streams component into the time-series database.
The main reaso why we’ve split the two services is for scalability and extensibility purposes:
Thanks to the Commons module, it’s easy to extend the group of services to make them accept an additional telemetry type;
As the frequency of incoming messages per telemetry type can vary, scaling feature affects only one service in the group;
Due to the incompatibility of the Java Client for InfluxDB with Quarkus native mode, the service is compiled using the standard java fast-jar mode.
More details can be found in the dedicated repository.
Microservice implemented on top of the Quarkus Framework.
This service is compiled and runs in native mode.
This service is responsible for importing the data from third-party services directly into the relational database.
More details can be found in the dedicated repository.
The following sections give an overview of the business logic implemented through the interaction between the microservices described above:
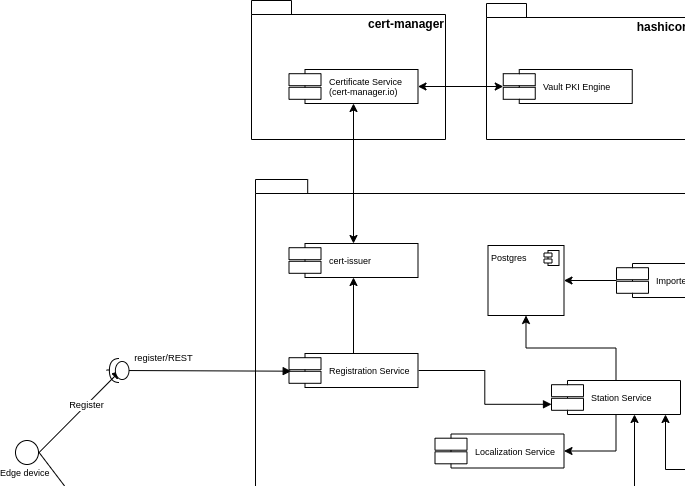
The registration phase of the COVID-19 use-case implementation is a key component of the overall business logic
It is actually the entry-level functionality for each and every edge device willing to connect and send the telemetry to the datacenter.
As the endpoint is secured via mutual authentication, the client is supposed to use the certificates or key-/trust- store pair available in the registration service repository at this link.
Once a register request has been received by the service, it performs the following actions within a single transaction:
Provisions a new key-/trust- store pair for the MQTT endpoint
Contacts the cert-issues deployed by cert-manager into the project namespace, asking for a certificate belonging to the service domain.
Encrypt the content of both the keystore and the truststore to make it safely deliverable back to the caller in the response data
Asks the Station Service to persist the data of the new measurement station.
If one of the two main actions fail, the operation is rolled back entirely.
BEWARE: it’s not allowed to delete an existing measurement station. We decided to adhere to the standard behavior of an IoT/Edge Computing system where a certificate/registration gets revoked only in case of a cyber attack to the registered device
The edge device produces MQTT messages containing the telemetry collected through its sensors.
ATM, we the use-case implementation exposes two endpoints:
gas
pollution
In order to connect to the MQTT endpoints exposed by the A-MQ broker, the client implemented on the edge side must use the key- / trust- store pairs received by the registration service. Thos ingo get validated by the CA connected to A-MQ and thus must belong to the COVID-19 domain
In order to reduce the network traffic and improve the process of transmitting data through the network, the data contained in the telemetry must be reduced to the minimum meaningful information:
Station ID
instant
telemetry-specific data
for each and every of those key/value pair we implemented a validator, implicit or esplicit, that checks the data as umarshal-time.
The above is possible using the mashalling/unmarshalling features coming with the java-based json libraries belonging to the Quarkus Universe.
The data contained in the telemetry sent by the edge device are, indeed, not complete/extended enough for a dashboard or analytic process and thus we went for the implementation of a route-like service which validates and enriches the incoming telemetry.
For each and every telemetry belonging to its specific domain, the [Collector Service]:
validates the telemetry unmarshalling the raw string;
connects to the Station Service to gather the data to enrich the data object;
marshals the enriched object into a json-based string
produces a new message to the internal streaming service;
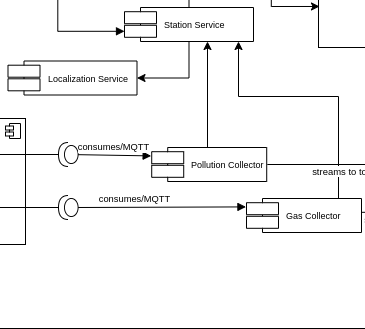
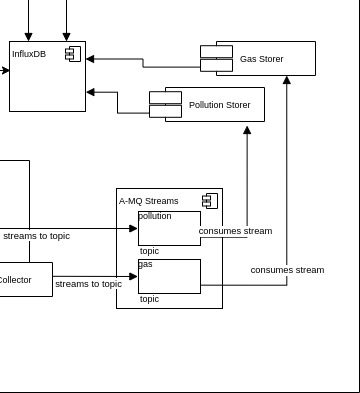
The main function of A-MQ streams is to provide to the entire namespace (and, eventually, to other namespaces requesting access to the internal data) a scalable dataflow management system. In the diagram snippet below, you can see how scalability works in terms of streaming service and consumers of the telemetry.
It would definitely be easier to develop the connection between datasource and database using plugin, but would definitely cut off most of the enterprise grade features a system must definitely have.
The scalability concept applies to the [Storer Service] exactly in the same way it applies to the collectors.
Each storer service is responsible for its specific data and is just one example of subscriber from the platform extensibility perspective.
About the timeseries database, we decided to go for une bucket and two different series, dedicated to each telemetry.
An additional telemetry would require a new series to be created.
---
openapi: 3.0.2
info:
  title: QioT - Registration Service
  description: Registration Service
  version: 1.0.0
paths:
  /register:
    summary: Path used to manage the list of registerrequests.
    description: "The REST endpoint/path used to list and create zero or more `RegisterRequest`\
      \ entities.  This path contains a `GET` and `POST` operation to perform the\
      \ list and create tasks, respectively."
    post:
      summary: Create a RegisterRequest
      description: Creates a new instance of a `RegisterRequest`.
      operationId: createRegisterRequest
      requestBody:
        description: A new `RegisterRequest` to be created.
        content:
          application/json:
            schema:
              $ref: '#/components/schemas/RegisterRequest'
        required: true
      responses:
        "201":
          description: Successful response.
          content:
            application/json:
              schema:
                $ref: '#/components/schemas/RegisterResponse'
  /register/{id}:
    summary: Path used to manage a single RegisterRequest.
    description: "The REST endpoint/path used to get, update, and delete single instances\
      \ of an `RegisterRequest`.  This path contains `GET`, `PUT`, and `DELETE` operations\
      \ used to perform the get, update, and delete tasks, respectively."
    get:
      summary: Get a RegisterRequest
      description: Gets the details of a single instance of a `RegisterRequest`.
      operationId: getRegisterRequest
      responses:
        "200":
          description: Successful response - returns a single `RegisterResponse`.
          content:
            application/json:
              schema:
                $ref: '#/components/schemas/RegisterResponse'
  /v1/register:
    post:
      requestBody:
        content:
          application/json:
            schema:
              $ref: '#/components/schemas/RegisterRequest'
      responses:
        "200":
          description: OK
components:
  schemas:
    RegisterRequest:
      title: Root Type for RegisterRequest
      description: ""
      type: object
      properties:
        serial:
          type: string
        name:
          type: string
        longitude:
          format: double
          type: number
        latitude:
          format: double
          type: number
        keyStorePassword:
          description: KeyStore Password
          type: string
      example:
        serial: some text
        name: some text
        longitude: 3.6
        latitude: 29.41
        keyStorePassword: some text
    RegisterResponse:
      description: ""
      required:
      - id
      - truststore
      - keystore
      type: object
      properties:
        id:
          description: ""
          type: string
        truststore:
          format: byte
          description: ""
          type: string
        keystore:
          format: byte
          description: ""
          type: string
      example:
        id: some text
        truststore: <FILE>
        keystore: <FILE>
RegisterRequest
serial must be a standard Raspberry Pi ID. More info here
name must be a single, lowercase word, validated using the regex
"[a-z0-9]([-a-z0-9]*[a-z0-9])?(\\.[a-z0-9]([-a-z0-9]*[a-z0-9])?)*"
longitude and latitude must be standard coordinate values. we recommend to use the Nominatim service by OpenStreetMap
RegisterResponse
id is the final/unique identification string of the measurement station and is string representation of an immutable universally unique identifier (UUID). The value must be embedded in each and every telemetry sent to the MQTT endpoints
truststore and keystore are string representation of the encrypted content for each store. We recommend to decrypt them on the edge device using the following code snippet:
...
import java.util.Base64;

...

byte[] content = Base64.getDecoder().decode(encodedString.getBytes(StandardCharsets.UTF_8));
PMS5003 output explained (source)
 {
    "stationId":string*,
    "instant":string**,
    "PM1_0":int,
    "PM2_5":int,
    "PM10":int,
    "PM1_0_atm":int,
    “PM2_5_atm":int,
    "PM10_atm":int,
    "gt0_3um":int,
    "gt0_5um":int,
    "gt1_0um":int,
    "gt2_5um":int,
    "gt5_0um":int
    "gt10um":int
}
(*) The instant value must be a string representation of an immutable universally unique identifier (UUID).
(**) The instant value must be a string representation of an instant using ISO-8601 representation
And example of expected values:
{"stationId":3,"instant":"2020-09-07T10:01:42.002818Z","gt0_3um":21366,"gt0_5um":5774,"gt1_0um":14,"gt2_5um":1355,"gt5_0um":126,"gt10um":59,"pm1_0":240,"pm2_5":156,"pm10":114,"pm1_0_atm":81,"pm2_5_atm":204,"pm10_atm":134}{
"stationId":int,
"instant":string*,
"adc":double,
"nh3":double,
“oxidising":double,
"reducing":double
}(*) The instant value must be a string representation of an immutable universally unique identifier (UUID).
(**) The instant value must be a string representation of an instant using ISO-8601 representation
And example of expected values:
{"stationId":0,"instant":2020-09-07T10:01:42.002818Z,"adc":128431.13772455092,"nh3":192387.0967741936,"oxidising":10594.594594594595,"reducing":192387.0967741936}you can spin up the overall environment on a standard Docker environment. We distribute docker-compose files in this repository.